
When investing in a high-end indoor golf simulator, the accuracy of the ball flight relies entirely on the launch monitor’s ability to measure exactly what happens in the microsecond the club meets the ball. Radar-based systems (like Trackman) track the ball’s flight over a distance using Doppler radar. However, indoors, where space is limited, photometric launch monitors (like the Uneekor Eye Mini, Foresight GC3, or Bushnell Launch Pro) are the gold standard.
Instead of tracking a long flight, photometric monitors use high-speed cameras to capture a rapid sequence of images immediately at impact. Here is exactly how they translate those images into precise spin axis and gear effect data.
Phase 1: The Photometric Capture Process
To understand the calculations, you must first understand the raw data collection.
- The Infrared Flash: When the system’s microphone or optical trigger detects a club entering the hitting zone, it fires a sequence of high-intensity infrared (IR) strobes. IR is used because it is invisible to the human eye (preventing distraction) and provides massive contrast.
- High-Speed Sequential Imaging: Synchronized with the flashes, the internal cameras (capturing at upwards of 3,000 to 10,000 frames per second) take a rapid burst of pictures.
- The Target Area: The cameras capture the ball resting on the mat, the moment of compression, and the first 12 to 18 inches of the ball’s flight.
Phase 2: Calculating Spin Axis (The Curve)
What is Spin Axis?
Every golf ball that leaves a clubface has backspin. If the ball is hit perfectly squarely, the axis of that backspin is perfectly horizontal (0 degrees), resulting in a straight shot. If the axis tilts to the left (negative degrees), the ball curves left (a draw or hook). If it tilts to the right (positive degrees), the ball curves right (a fade or slice).
The Calculation Method:
Photometric monitors do not “guess” the spin axis based on club path; they measure it directly from the ball.
- Pattern Recognition (Dimple Mapping): Older systems required reflective dots or marked lines on the ball. Modern systems (like Uneekor’s “Dimple Optix”) use advanced contrast algorithms to map the unique arrangement of the ball’s dimples or the printed logo in the very first frame.
- Spatial Translation: The software looks at the exact same dimple cluster in frame 1, frame 2, frame 3, and frame 4.
- 3D Vectoring: By measuring exactly how far and in what direction that specific pattern of dimples rotated between the frames, the onboard processor constructs a 3D model of the ball in digital space.
- The Final Output: The algorithm calculates the precise RPM (Revolutions Per Minute) based on the speed of the rotation, and the exact degree of tilt of the rotation axis (Spin Axis). Because the cameras capture this within inches of impact, it represents the purest spin data before air resistance alters it.
Phase 3: The Physics of Gear Effect
To understand how monitors handle gear effect, we must define it. Gear Effect is a physical phenomenon that occurs during an off-center strike, particularly with hollow-body clubs like drivers and fairway woods (where the center of gravity is far behind the clubface).
Imagine the clubhead and the golf ball are two meshing gears.
- Toe Strike: If you hit the ball on the toe of the club, the force of the ball pushes the toe backward. The clubhead twists open around its center of gravity. As the face twists open (turning to the right), it acts like a gear, grabbing the ball and imparting the opposite spin (tilting the ball’s spin axis to the left). This causes a hook.
- Heel Strike: If you hit it on the heel, the heel pushes back, the face twists closed, and the gear effect imparts rightward tilt on the spin axis, causing a slice.
- High/Low Strikes: A strike high on the face causes the clubhead to tilt backward, imparting less backspin. A low strike causes it to tilt forward, imparting more backspin.
Phase 4: How Photometric Monitors Measure Gear Effect
This is where the magic of photometric tracking shines, and where it differs from cheap estimators.
1. Direct Ball Observation (The Primary Method)
The most important thing to know is that a high-end photometric monitor does not need to calculate gear effect to show you an accurate ball flight. Because the cameras are directly measuring the dimples rotating in space (as explained in Phase 2), they are measuring the result of the gear effect. Even if the club path was perfectly straight, if the ball was struck on the toe, the gear effect will tilt the spin axis to the left. The high-speed cameras see this leftward tilt immediately, calculate it, and render a draw on the screen. The monitor doesn’t need to know why the axis tilted; it just knows that it did.
2. Clubhead Tracking (The Diagnostic Method)
While the ball data tells you where the ball is going, premium monitors use clubhead tracking to tell you why it went there.
Systems like the Uneekor Eye Mini use fiducial markers (club stickers), while newer systems like the Square Omni use quad-camera arrays to track the naked clubface. By capturing images of the clubface at the exact millisecond of impact, the monitor can identify the exact coordinate of the strike location (e.g., 10mm toward the toe, 5mm high).
When a user reviews their data, the software correlates the observed strike location (the cause) with the measured spin axis and backspin (the effect). This allows players and coaches to definitively see gear effect in action, proving that a severe hook wasn’t caused by a bad swing path, but by a 1-inch toe strike causing the clubhead to twist.
Interactive Demonstration: Gear Effect Simulator
To truly understand how strike location dictates spin axis and ball flight via gear effect, use the interactive simulator below. Adjust the impact location on the clubface to see how the “gears” interact and alter the resulting shot shape.
7 Steps to Understanding How Photometric Launch Monitors Calculate Spin Axis and Gear Effect
When designing a world-class indoor golf simulator setup, precision is everything. Golfers hit balls into high-impact screens, expecting the virtual software to flawlessly mirror their real-world ball flight. But while you watch the virtual ball curve through the air, an incredibly complex sequence of calculations takes place in a fraction of a millisecond.
Understanding how photometric launch monitors calculate spin axis is essential for anyone looking to build, calibrate, or optimize an indoor golf simulator environment. Unlike radar-based units that track total ball flight over dozens of yards, camera-based photometric hardware works entirely within a highly constrained physical tracking zone. By capturing a rapid sequence of high-resolution images immediately after the ball leaves the clubface, these advanced optical arrays decode the hidden physics of your golf swing.
The “Quick Answer” / Key Takeaways
- Direct Vision Tracking: Photometric systems use high-speed infrared cameras to map the physical movement of dimples or markers on the ball, directly measuring spin rather than estimating it.
- 3D Coordinate Mapping: Spin axis is calculated by measuring the horizontal and vertical angular displacement of the ball’s surface patterns between consecutive high-speed photo frames.
- The Gear Effect Reality: Off-center hits cause the clubhead to twist, imparting an immediate counter-spin on the ball; photometric monitors capture this physical rotation instantly, even without measuring the club itself.
- Indoor Superiority: Because camera systems measure the true rotation of the ball within the first 12 to 18 inches of flight, they are inherently more accurate in short indoor spaces than radar tracking units.
1. The Core Physics of Optical Tracking Architecture
To comprehend how photometric launch monitors calculate spin axis, you must first look at the raw physical hardware operating next to the hitting mat. Photometric systems rely on ultra-high-speed cameras paired with specialized lighting arrays. While radar units rely on the Doppler frequency shift of bounced microwaves, camera systems act as high-speed scientific microscopes.
When a ball rests on the hitting mat, it resides in a precisely defined three-dimensional volume known as the tracking zone. The moment the club triggers the launch monitor’s sensors—either via acoustic microphones or optical motion detection—the hardware springs into action.
The machine fires a succession of high-intensity infrared (IR) flashes. These strobes emit light at specific nanometer wavelengths that are entirely invisible to the human eye, preventing any visual distractions during your downswing. The primary purpose of this intense IR blast is to create massive visual contrast on the ball’s surface, reflecting off the white cover while keeping the background dark and unreadable to the image processor.
Synchronized perfectly with these microsecond strobes are industrial image sensors capturing anywhere from 3,000 to 10,000 frames per second. These are not standard video cameras; they are global-shutter sensors designed to eliminate motion blur entirely. If any motion blur exists in the raw frame, the internal edge-detection algorithms will fail to lock onto the ball’s surface features, rendering a “no-read” in your simulator software.
2. Image Processing and Surface Topology Mapping
Once the high-speed camera array captures the sequential images, the raw frames are immediately passed to an internal field-programmable gate array (FPGA) or a high-performance onboard digital signal processor (DSP). The very first computational step is isolating the golf ball from the rest of the image frame.
The system runs an edge-detection filter to identify the perfect circle of the golf ball silhouette. Once the boundaries of the ball are established in a two-dimensional pixel matrix, the processor analyzes the internal surface topology of the ball. This is where advanced software algorithms differentiate themselves.
Historically, older launch monitors required users to apply highly reflective silver dots or explicit black lines to the golf ball. The cameras would easily track these high-contrast markers across frames. However, modern photometric launch monitors utilize advanced dimple-mapping algorithms. By analyzing the subtle shadows created inside individual dimple recesses by the angled IR strobes, the software creates a digital thumbprint of the ball’s visible face in frame one.
This digital thumbprint maps specific coordinates of the ball’s surface markings, brand logos, or natural dimple edges. This topology map forms the mathematical baseline. The software doesn’t just see a white circle; it sees a highly complex, unique pattern of coordinates resting on a 3D spherical plane.
3. Vector Analysis: Calculating Total Spin and Revolution Speed
With the surface topology mapped in the first frame, the processor immediately compares it to the subsequent images captured fractions of a millisecond later. As the golf ball flies off the face, it rotates rapidly. This rotation shifts the position of the mapped dimples and logos.
The launch monitor’s core algorithm runs a cross-correlation mathematical model to find the identical dimple clusters in frame two, frame three, and frame four. By calculating the exact pixel displacement of these surface patterns, the system determines how many degrees the ball has rotated along its three physical dimensions (X, Y, and Z axes).
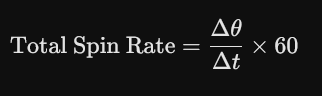
Where $\Delta \theta$ is the angular displacement in degrees measured between frames, and $\Delta t$ is the precise time interval between the camera shutters. Because the time step ($\Delta t$) between frames is an immutable hardware constant managed by the internal clock of the global shutter, the calculation of total spin rate is incredibly precise. If the dimple pattern moves a substantial distance between frames, the spin rate is high. If the displacement is minute, the spin rate is low.
Technical specifications of global shutter image sensors used in scientific motion analysis
4. Deciphering the Spin Axis Tilt
Knowing the total spin rate is only half of the equation required to map ball flight. To determine if your ball will fly straight, hook into the trees, or slice off the screen, the system must calculate the exact tilt of the axis around which that spin is occurring. This is where learning how photometric launch monitors calculate spin axis becomes fascinating.
Imagine a line running straight through the center of the golf ball, perfectly parallel to the horizon and perpendicular to your target line. If the ball rotates purely backward around this line, its spin axis is exactly 0 degrees. This results in pure backspin, creating aerodynamic lift via the Magnus effect without any lateral curvature.
However, if the clubface is open or closed relative to the swing path at impact, that horizontal axis tilts.
- Negative Spin Axis: If the left side of the axis tilts downward toward the ground, the axis angle becomes negative. The ball is now spinning with a tilt to the left, which causes a draw or a hook.
- Positive Spin Axis: If the right side of the axis tilts downward, the axis angle is positive, causing the ball to slice or fade to the right.
Photometric monitors calculate this tilt by evaluating the vertical and horizontal vectors of the moving dimples. If the mapped dimples are moving purely from the bottom-left of the frame toward the top-right across successive images, the software uses a trigonometric arc-tangent function to translate that linear pixel movement back into a precise three-dimensional angular tilt of the physical sphere.
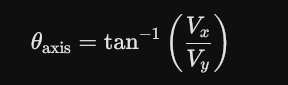
Where V_x represents the horizontal velocity vector of the surface patterns and V_y represents the vertical velocity vector. This directly calculated angle is output to your simulation software as the true spin axis.
5. The Mechanical Reality of Gear Effect
To truly master indoor golf metrics, you must understand the interaction between spin axis and the physics of the clubhead, universally known as the gear effect. Gear effect is a mechanical phenomenon that occurs whenever a golf ball is struck outside the absolute center of gravity (CG) of a clubhead—most prominently on large, hollow-body clubs like drivers and fairway woods.
When a golf ball impacts the face of a driver away from the center of gravity, the immense force of the impact causes the clubhead to twist violently in mid-air.
- Toe Strikes: When the ball hits the toe side of the face, the force pushes the toe backward, twisting the clubhead open around its center of gravity.
- Heel Strikes: When the ball hits the heel side of the face, the heel is shoved backward, twisting the clubhead closed.
This interaction acts exactly like two interlocking gears. As the clubhead twists open to the right during a toe strike, the face brushes against the surface of the ball. Just like gears rotating in opposite directions, the rightward twisting of the clubface forces the golf ball to rotate violently in the opposite direction—tilting its spin axis sharply to the left.
Because of gear effect, a toe strike will automatically impart powerful hook spin onto the ball, even if your swing path was perfectly down the target line. Conversely, a heel strike forces the clubhead to twist closed, gearing across the ball cover and imparting severe slice spin to the right.
6. How Camera Systems Handle and Expose Gear Effect Data
The critical advantage of photometric launch monitors is how they manage this gear effect data. Because camera-based systems look directly at the actual physical rotation of the ball cover immediately after it leaves the face, they do not need to guess or simulate gear effect.
Radar units often struggle with gear effect indoors because they lack the physical flight distance to observe the lateral aerodynamic curvature caused by the tilted spin axis. If a radar unit calculates spin based on club tracking metrics alone, it might miscalculate a toe strike as a straight block rather than a severe snap-hook.
Photometric launch monitors, however, see the physical manifestation of the gear effect instantly. The high-speed cameras record the immediate leftward or rightward tilt of the dimples within the first twelve inches of flight. The spin axis output is entirely accurate because it is a direct measurement of physical reality, not a mathematical estimation derived from club telemetry.
Furthermore, advanced photometric systems with dual or quad-camera configurations utilize secondary tracking arrays to look at the clubhead face itself. By identifying the exact millisecond of impact, the software can pinpoint the precise coordinate of the strike location on the clubface faceplate. When the system displays your data, it combines the observed toe/heel strike location with the measured spin axis, explicitly diagnosing the exact cause of your ball’s curvature.
| Strike Location | Clubhead Twist Action | Resulting Spin Axis Tilt | Resulting Ball Flight Shape |
| Exact Center | Zero Horizontal Twisting | 0° (Perfect Horizontal Axis) | Straight True Distance |
| Extreme Toe | Twists Open (Rightward Rotation) | Negative Angle (Leftward Tilt) | Draw / Snap Hook |
| Extreme Heel | Twists Closed (Leftward Rotation) | Positive Angle (Rightward Tilt) | Fade / Power Slice |
| High Face | Tilts Backward (Delofts Face) | Reduced Backspin Value | High Launch, Low Spin Knuckler |
| Low Face | Tilts Forward (Adds Effective Loft) | Increased Backspin Value | Low Launch, High Spin Balloon |
7. Optimizing Your Indoor Environment for Flawless Spin Calculation
Now that you know the intricate steps of how photometric launch monitors calculate spin axis, you can use this knowledge to error-proof your indoor simulator studio. Because these calculations depend entirely on pixel-perfect image contrast, minor environmental flaws can degrade your machine’s accuracy.
First, you must eliminate ambient light pollution. Standard household incandescent bulbs or direct sunlight streaming through a garage window can emit stray infrared wavelengths. If these external IR waves interfere with the launch monitor’s sensors, the cameras will struggle to clearly define the dimple edges. Ensure your hitting bay utilizes controlled LED lighting positioned away from the direct line of sight of the launch monitor lenses.
Second, consider your choice of golf balls. Since modern monitors depend on mapping surface shadows and logos to calculate vector displacement, using a completely blank, scuffed, or dirty golf ball introduces major digital friction. If a ball is heavily marked with dirt, or if the cover is completely devoid of any logos or distinct dimple variations, the cross-correlation algorithm can struggle to match patterns between frame one and frame two.
Step-by-step calibration guide for maximizing photometric monitor read rates
Recommendations
To maximize the immense tracking potential of an advanced photometric launch monitor, you must ensure that your hitting environment doesn’t compromise the data loop. The most critical physical interface in any indoor simulator is the hitting mat. Standard, cheap driving range mats utilize dense, hard rubber backings with low-grade nylon turf. When a club impacts this rigid surface, it bounces artificially, causing abnormal clubhead twisting before the ball is launched. This introduces artificial gear effect data that ruins your practice sessions.
To ensure your launch monitor is reading genuine swing mechanics, you must upgrade your setup to a premium, injury-preventing hitting surface. We strongly recommend investing in a Fiberbuilt Flight Deck or a Real Feel Country Club Elite Hitting Mat. These premium systems utilize deep-pile nylon turf architectures that allow the clubhead to slide naturally through the ball, perfectly mimicking the physical resistance of real grass divots.
Additionally, to process high-resolution dimple mapping and frame-by-frame vector mathematics without experiencing frustrating delays or frame drops in third-party simulation programs like GSPro, your computing core must be robust. Do not bottleneck a high-ticket photometric launch monitor by running it on an integrated graphics laptop. Ensure your simulator garage or media room is powered by a dedicated gaming PC equipped with an Nvidia RTX 4070 Ti SUPER graphics card and a minimum of 32GB of DDR5 RAM. This hardware profile guarantees instant shot rendering, allowing your software to display the calculated spin axis the exact moment your ball meets the impact screen.
Preventative Maintenance Lens Care Checklist
To maintain laboratory-grade tracking accuracy and prevent dropped shots on your photometric launch monitor, perform this three-step lens cleaning protocol every 500 swings:
- Step 1: The Particulate Blast. Never wipe a dry launch monitor optical window with a cloth immediately. Hitting mats constantly shed abrasive nylon micro-particles. Use a dedicated can of compressed air to blast any floating dust away from the camera recesses.
- Step 2: The Optical Solution. Apply two drops of non-streak optical lens cleaner directly to a fresh, ultra-fine microfiber cloth. Never spray fluid directly onto the launch monitor housing, as moisture can seep past the seals into the high-speed flash circuitry.
- Step 3: The Concentric Wipe. Gently wipe the glass windows in a tight, overlapping concentric motion starting from the center of the lens and moving outward. This prevents cross-contamination and ensures the high-intensity infrared strobes pass through the glass with zero optical refraction.